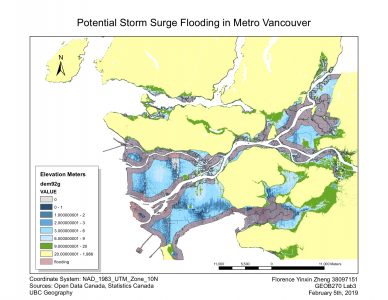
Storm Surges are the abnormal rises of sea water generated by atmospheric pressure changes associated with a storm. It could lead to seawater flooding in location far inland from the coast. With sea level rise and climate change weather events get more prevalent globally, Metro Vancouver can be vulnerable to storm surge flooding.
In this lab assignment, as a GIS analyst with Metro Vancouver, I was assigned to create a series of maps that show the areas in Metro Vancouver at potential risk to flooding results from storm surge. My goals are to visualize the elevation data to determine areas for possible storm surge flooding, to show the impact of flooding to roads and school, and the decision in hospital location planning.
To achieve my goals, I retrieved DEM, school location and roads data from Open Source Canada, Statistic Canada and City of Vancouver. Specifically, for example, I used buffer tool to create outline of flooding area, and reclassified raster layer to differentiate immediate danger zone from other area. In the map production process, I recognized that the resolution of data really matters in this analysis. Analyzing storm surge scenario required precise data with higher resolution because the analyzation and evaluation of storm surge are on unit of as small as 6 meters. Data with smaller resolution may cause errors and generalization when it comes to smaller area, which can have negative impact on setting up alert line for flooding and other emergency planning.
I learned about how to
- identify data I need
- access GIS Analysis tools
- to reflect on data integrity