
Other maps produced:
Housing Cost in Vancouver and Montreal
Housing Affordability in Vancouver and Montreal
introduction
In this assignment, I worked with census data to analyze the housing affordability problem in Metro Vancouver. Quantitative data classification and analysis was applied in this assignment. I have a chance to explore various data classification methods and gained an in sight in how this could impact the maps produced.
Quantitative Data Classification
I produced four maps of housing costs in Metro Vancouver using 4 different classification methods: standard deviation, natural breaks, manual breaks and equal interval. In the assignment, I was asked to explained my choices of classification methods as a journalist or an estate agent preparing a presentation for prospective home buyers near UBC. Here is my answers:
I will choose Natural Breaks for my audience. Because this classification method starts with 0-403559 which is a interval relatively close to the average value of Canadian housing. Therefore, this classification method can allow readers to compared the housing costs with the normal/average cost, then make sense of the level of Vancouver housing costs.
As a real estate agent, I will choose Natural Breaks as my classification method. This method shows the housing costs near UBC as just slightly higher than other areas, while other classification method show a great gap between area near UBC and other areas. This will make area near UBC more appealing to prospective home buyers it visually increase the level of affordability of housing in the area.
There are ethical implications for my choice of classification method. For example, choosing Natural Breaks as a agent trying to attract home buyers is because this representation of housing costs minimize the price gap between housing near UBC and other area. While this representation is accurate, it is also somehow misleading in eliminating the housing costs difference among these geographic areas. Since every classification method has its own pro and con, it is necessary to consider the purpose of data analysis and how the information can be perceived and represented in a way that is least biased.
Data Uncertainty
There are a few areas in my map that have no housing cost of number of dwelling data associated with it. This is mostly because this area is either Indigenous Land or a location for schools, parks and etc.
cost of housing
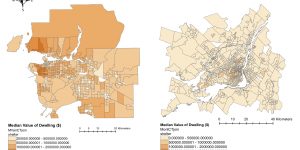
Map: Housing Cost in Vancouver and Montreal
This map represents the shelter cost of communities in Vancouver and Montreal. Housing cost data was acquired from the CHASS, a website organized by University of Toronto to compiled census data from Statistics Canada. Here the shelter cost is the median value of dwelling ($) in the census tract (CT). However, median value of housing cost may be less representative of the data set because it is sensitive to the extreme values.
housing affordability
Map: Housing Affordability in Vancouver and Montreal
This map shows the difference in housing affordability in Vancouver and Montreal. Housing affordability here is calculated by dividing median house price by median annual household income. This is a better indicator of housing affordability than housing cost alone because people living in large cities may have higher income than small cities. Normalizing housing cost data by income data will help making the affordability comparison more accurate.
The rating categories of housing affordability is 0-3, 3-4, 4-5, and above 5. The choice of classification method depend on the map producer; there is no right answer for what method to use. It is not always trusted since the cartographer can use different classification methods to create maps with varying visual impressions.
I believe housing affordability is a good indicator a city's livability. Affordable housing is the basics of livelihood since people need a home and community to support their personal development. Although there are other factors, such as pollution level and political stability, to consider, housing affordability is essential in evaluating livability of a city.
Learning Significance